Le 9 août dernier, le GIEC publiait son 6e rapport. Tout le monde en a entendu parler ; on sait que les nouvelles ne sont pas bonnes. Tâchons d’y voir plus clair et pour commencer arrêtons-nous un instant sur le GIEC.
Qu’est-ce que le GIEC ?
Voici ce qu’on peut lire sur le site de l’organisation :
« Le Groupe d’experts intergouvernemental sur l’évolution du climat (GIEC) a été créé en 1988 en vue de fournir des évaluations détaillées de l’état des connaissances scientifiques, techniques et socio-économiques sur les changements climatiques, leurs causes, leurs répercussions potentielles et les stratégies de parade. »
En d’autres termes, le GIEC compile, étudie et évalue la littérature scientifique relative au climat pour en faire des synthèses, mises à jour périodiquement. Ses auteurs ne font pas de recommandations, ils ne donnent pas d’ordres aux décideurs, ils font état des découvertes récentes et modélisent des scénarios, en fonction des données disponibles, pour anticiper l’avenir climatique.
Cette fois, les 234 auteurs – triés sur le volet ET bénévoles – ont épluché 14 000 publications pour accoucher d’une première version du rapport. Celle-ci a été partagée à des relecteurs qui ont pu formuler 78 000 commentaires, tous pris en compte pour obtenir la deuxième version. La mouture remaniée qui compte quelque 4 000 pages, ainsi que le résumé technique et celui à destination des décideurs politiques, a finalement été soumise à tous les représentants des États membres du GIEC, qui l’ont validée, ligne après ligne.
Ce système de publication « à repasse » minimise le risque d’erreur et indique que les 195 nations représentées – Chine et États-Unis compris – ont lu et validé les conclusions du rapport.
Rappelons enfin que ce rapport est le fruit du travail du groupe 1 du GIEC, qui en compte trois.
- Le groupe 1 étudie le fonctionnement physique du climat et modélise son évolution.
- Le groupe 2 s’intéresse à la vulnérabilité de nos sociétés face aux changements climatiques, en évaluant les conséquences positives et négatives qu’ils peuvent avoir ainsi que la possibilité de s’y adapter.
- Le groupe 3 quant à lui évalue les solutions existantes pour diminuer les émissions de gaz à effet de serre ou atténuer de toute autre manière les changements climatiques.
Les rapports des groupes 2 et 3, qui viennent compléter celui qui nous intéresse aujourd’hui, ont été respectivement publiés en février et mars 2022. Une synthèse des 3 rapports doit paraître en septembre 2022.
Maintenant que nous avons présenté le GIEC et expliqué pourquoi son travail gagnait à être pris au sérieux, passons au contenu du rapport en lui-même, qui comporte un certain nombre de nouveautés par rapport aux précédents (le 5e datait de 2014).
Vue d’ensemble
Voici les quelques points clés à retenir sur l’état actuel du climat :
- Il est incontestable que les activités humaines sont à l’origine du changement climatique.
- Les changements climatiques récents, qu’ils affectent l’atmosphère, les océans, la cryosphère ou la biosphère, sont généralisés, rapides et s’intensifient. Ils sont sans précédent depuis des milliers d’années.
- Le réchauffement climatique rend les phénomènes extrêmes, notamment les vagues de chaleur, les fortes précipitations et les sécheresses, plus fréquents et plus sévères.
- L’augmentation de la température en surface accélère la montée des eaux et cause le réchauffement, la perte d’oxygène et l’acidification des océans.
- À moins d’une réduction immédiate, rapide et à grande échelle des émissions de gaz à effet de serre, limiter le réchauffement à 1,5 °C sera hors de portée.
Tâchons maintenant de clarifier certaines choses.
« Il est incontestable que l’influence humaine a réchauffé l’atmosphère, les océans et les terres. »
Le 6e rapport met en quelque sorte fin au débat sur l’origine, anthropique ou non, du réchauffement climatique. Il est désormais « sans équivoque » que l’activité humaine – par les émissions de gaz à effet de serre qu’elle génère – réchauffe la planète, alors que cela n’était « que » extrêmement probable dans le 5e rapport, ce qui laissait une marge de contestation, plus ou moins scientifique, aux sceptiques.
Voyons plutôt le schéma présenté dans le résumé à l’intention des décideurs politiques (toutes les légendes des schémas qui vont suivre ont été traduites par Le Bon Pote).
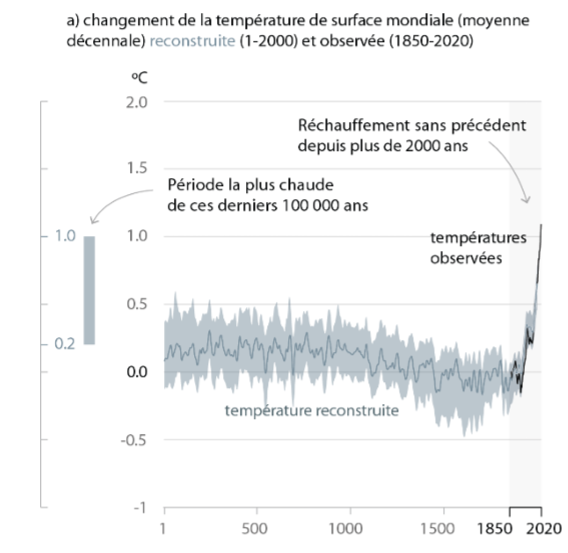
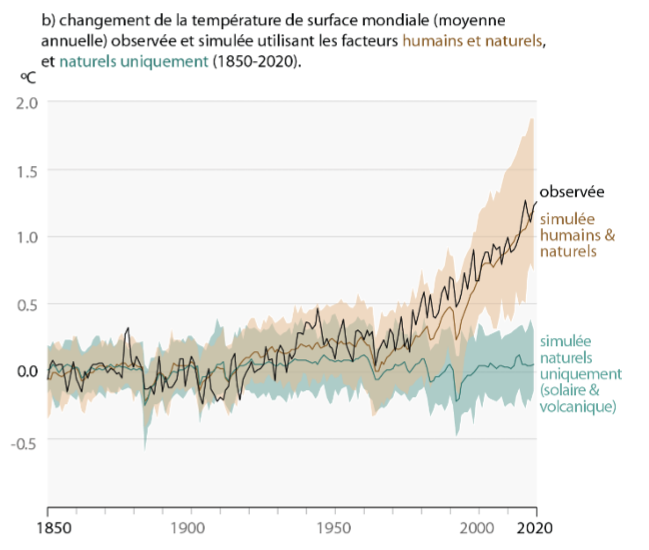
La figure de gauche montre que l’augmentation de la température depuis 1850 est sans précédent depuis au moins 2 000 ans. Le rapport indique qu’elle est même très probablement sans précédent depuis au moins 100 000 ans.
La figure de droite confronte trois courbes :
- La courbe noire correspond aux températures observées
- La courbe verte correspond à une modélisation de l’évolution de la température, sur laquelle n’influeraient que les facteurs naturels (irradiance solaire et éruptions volcaniques).
- La courbe marron correspond à une deuxième modélisation, intégrant cette fois les facteurs humains, au premier rang desquels on trouve les émissions de CO2.
Nous remarquons que la courbe verte est à peu près constante, ce qui signifie que l’influence des facteurs naturels est quasi nulle sur cette période. En revanche, la courbe marron se superpose aux températures observées.
Conclusion ? Ce sont les facteurs humains qui font décrocher la courbe.
Le diagramme suivant montre la même chose, d’une autre manière :
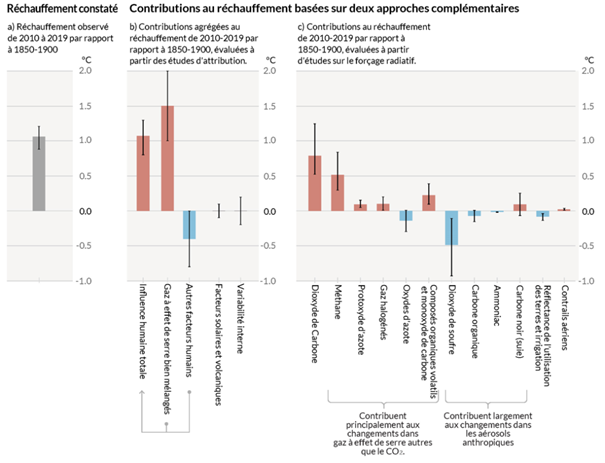
Ces dix dernières années ont été plus chaudes de 1,1° C par rapport au début de l’ère industrielle (1850-1900). L’influence humaine est manifeste.
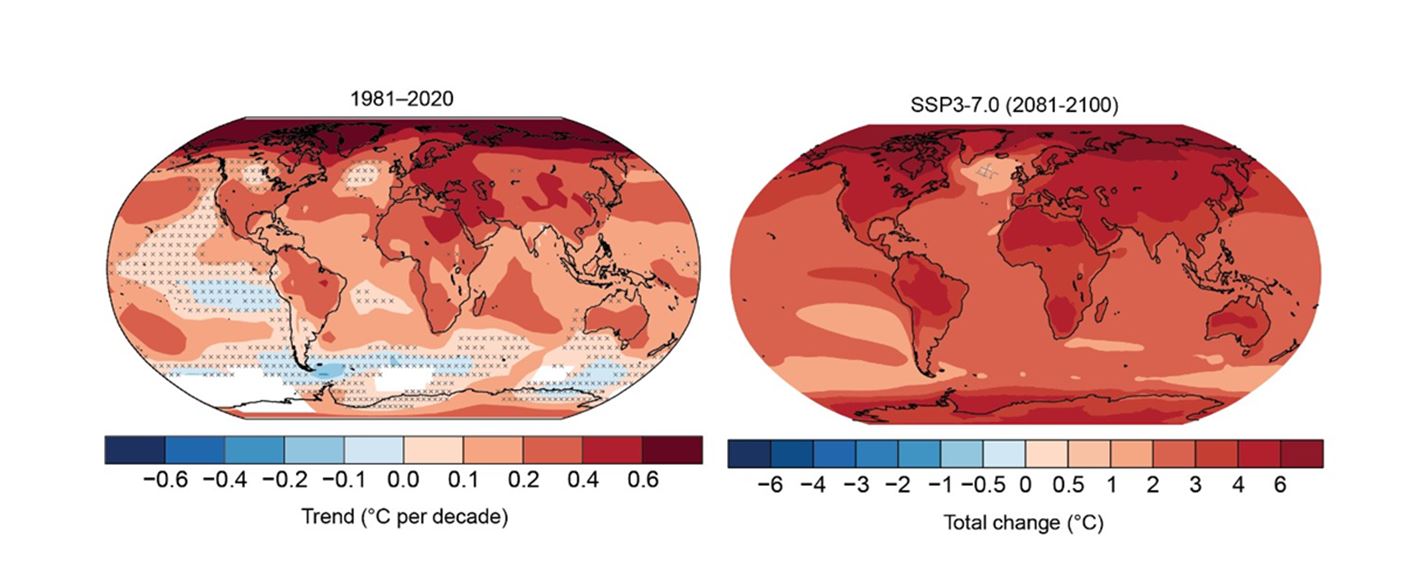
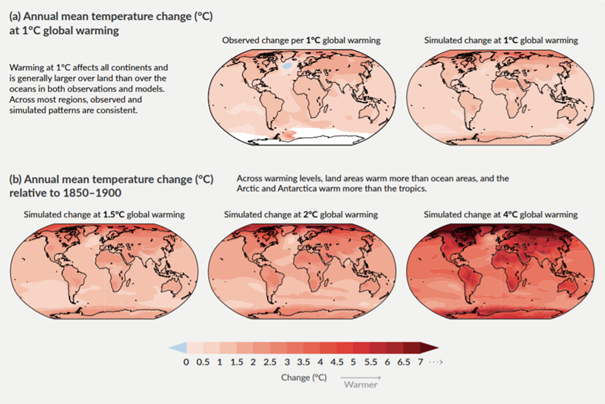
A ce propos, il faut rappeler que les terres se réchauffent plus que les océans. Ainsi, une augmentation moyenne de 1,5 °C correspond dans certaines régions du monde à une augmentation de 3 °C… Et comme nous vivons tous sur des territoires émergés, il faut s’attendre à ce que le réchauffement ressenti soit plus élevé que les températures annoncées.
Un schéma du rapport illustre ce point :
Chaque tonne supplémentaire de CO2 rejetée dans l’atmosphère augmente le réchauffement.
Le réchauffement est quasi proportionnel aux émissions cumulées de CO2 dans l’atmosphère. Si chaque tonne de CO2 rejetée amplifie le réchauffement, par contraposée, toutes les émissions évitées diminuent le réchauffement.
C’est ce que l’on observe clairement sur le graphique suivant :
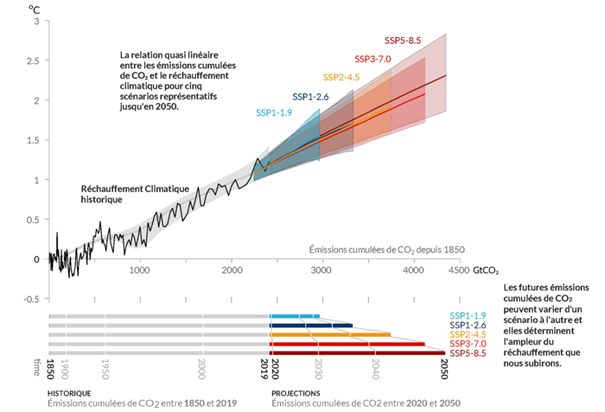
Ouvrons une parenthèse pour expliquer à quoi correspondent les scénarios retenus par le GIEC dans ce rapport, indiqués dans 5 couleurs différentes :
- SP1-1.9
- SSP1-2.6
- SSP2-4.5
- SSP3-7.0
- SSP5-8.5
Prenons l’exemple du scénario jaune, SSP2-4.5.
SSP signifie Shared Socio-economical Pathway et désigne un scénario qui tient compte de plusieurs paramètres tels que l’évolution de la population mondiale, le rythme de la croissance ou encore le degré de coopération internationale face à l’urgence climatique. SSP2 renvoie donc à un scénario socio-économique défini, surnommé « la voie médiane ». Pour connaître le détail des cinq scénarios, rendez-vous sur la page Wikipedia correspondante.
4.5 désigne le niveau de forçage radiatif associé au scénario SSP2. Cette notion, qui est essentielle pour bien comprendre le phénomène du réchauffement climatique, est expliquée très clairement par Le bon pote ici. Aujourd’hui le forçage radiatif est de 2,3 W/m². Rappelons qu’il augmente chaque fois que du CO2 est émis et stocké dans l’atmosphère. Et que plus il augmente, plus la température à la surface du globe augmente.
Pour faire simple, le scénario bleu clair correspond au meilleur des mondes, dans lequel la transition énergétique se ferait à vitesse grand V, de façon concertée aux niveaux national et international ; la courbe rouge foncé modélise le scénario catastrophe, avec une croissance galopante, une utilisation redoublée des énergies fossiles et aucune mesure prise pour réduire les émissions. Les deux sont également improbables.
Dans la table suivante, le GIEC indique comment évoluera la température, à court, moyen et long terme, selon le scénario retenu.
Rappelons que very likely range signifie que l’intervalle donné est sûr à plus de 90 %.

Pour l’heure nous suivons plutôt la courbe jaune, SSP2-4.5, qui conduit à une augmentation 2 °C aux alentours de 2050, et de 2,7 °C à l’horizon 2100.
Le changement climatique affecte déjà toutes les régions habitées de la planète.
Commençons par jeter un œil aux schémas suivants :
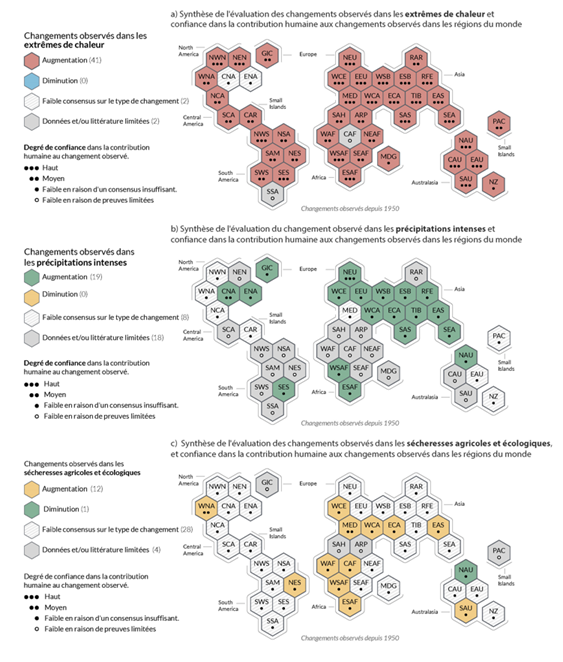
Le premier schéma indique que les vagues de chaleur extrême vont s’amplifier partout dans le monde, avec un degré de certitude élevé dans la plupart des cas.
Les deux suivants montrent que les précipitations intenses augmenteront dans les régions coloriées en vert tandis que les sécheresses gagneront du terrain dans celles en jaune. Cependant, ces prévisions sont moins fiables, en raison d’une absence de consensus ou d’un panel de données limité.
Le réchauffement amplifie les phénomènes climatiques extrêmes (vagues de chaleur, fortes précipitations, sécheresses, cyclones) – ou l’effet boule de neige.
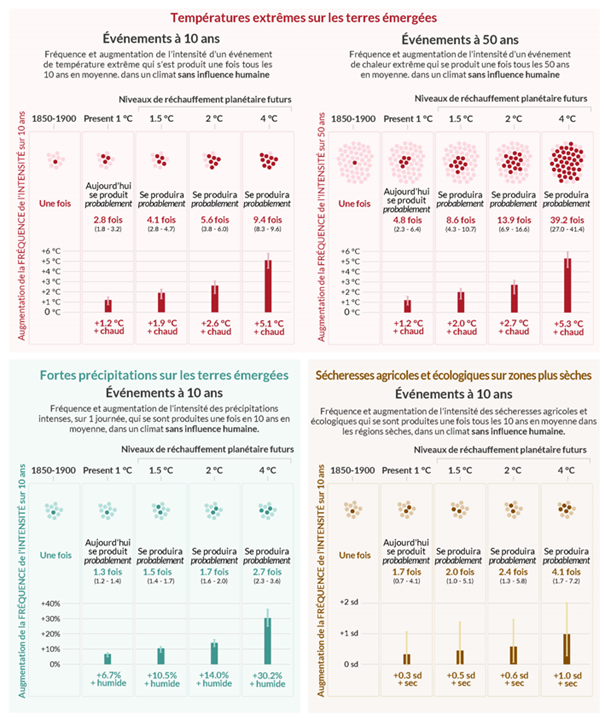
Si l’on prend l’exemple des canicules se produisant une fois tous les dix ans avant l’ère industrielle, on observe qu’aujourd’hui, du fait d’une augmentation de 1 °C de la température moyenne, elles se produiront probablement 2,8 fois par décennie.
Si le réchauffement atteint 2 °C (ce qui risque d’être le cas) elles se produiront en moyenne 5,6 fois par décennie, et leur intensité, qui était d’environ +1,2 °C avec un réchauffement de 1 °C, passera à +2,6 °C.
Les précipitations intenses et les sécheresses seront sujettes à un emballement comparable, quoique dans des proportions moindres.
Ce qu’il faut conclure de cela ? Eh bien, que plus la température moyenne augmentera à la surface du globe, plus violentes et fréquentes seront les canicules, les sécheresses, les inondations, les précipitations…
En d’autres termes, et comme le dit le climatologue Christophe Cassou auteur du rapport :
« Chaque fraction de degré compte car elle conditionne le risque associé aux événements extrêmes. Si on ne parvient pas à contenir le réchauffement climatique à + 1,5 °C, il faut tout faire pour le limiter à + 1,6 °C. »
Budgets carbone :
Depuis la publication du 1er rapport du GIEC en 1990, c’est-à-dire en trente ans, 1 000 milliards de tonnes de CO2 (GtCO2) ont été émises. C’est presque la moitié de nos émissions cumulées (2 390 GtCO2) depuis le début de l’ère industrielle, en 1850.
Compte tenu de la relation quasi proportionnelle entre les émissions cumulées et l’augmentation de la température moyenne à la surface du globe, il est possible de calculer quelle marge il nous reste en fonction d’un objectif de température à atteindre, ou à ne pas dépasser.
C’est de là que viennent les budgets carbone. La table qui suit indique la quantité de CO2 qui peut être encore rejeté dans l’atmosphère avant d’atteindre un certain pallier, à différents degrés de certitude.
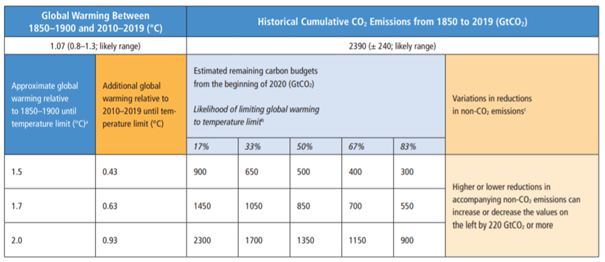
Tâchons de décrypter ce que nous avons sous les yeux. Si nous ne voulons pas dépasser +1,5 °C par rapport à l’ère préindustrielle, sachant que nous sommes déjà à +1,07, cela implique de nous en tenir à +0,43 °C à l’avenir, soit un budget carbone de 300 GtCO2 pour maximiser nos chances (83 %), et jusqu’à 500 si nous sommes joueurs et que nous acceptons de jouer à pile ou face la catastrophe à venir. Un rejet de 900 gigatonnes supplémentaires nous ferait très probablement avoisiner les +2 °C, avec les conséquences que nous avons vues.
Étant donné que les émissions mondiales sont actuellement d’environ 40 GtCO2/an, ce budget risque de réduire comme peau de chagrin, ou fondre comme neige au soleil… D’où les changements rapides, généralisés et soutenus dans le temps que le GIEC appelle de ses vœux. Les décideurs politiques, mais pas seulement, les entreprises et les citoyens aussi, ont maintenant les cartes en main, l’état des lieux est clair : il est urgent d’agir.
Le mot de la fin
« Sans équivoque » : cette formule est un grand pas pour le GIEC. La responsabilité de l’activité humaine est désormais démontrée. Production d’énergie, industrie, transport, résidentiel, tertiaire, agriculture, traitement des déchets, tous ces secteurs, parce qu’ils émettent des gaz à effet de serre en quantités trop importantes à l’échelle globale, contribuent à réchauffer la planète.
Si les conséquences du business as usual telles que décrites dans ce rapport – les scénarios rouges – font « froid » dans le dos, le pire peut encore être évité. Pour cela, il s’agit d’avoir conscience de la menace qui pèse, d’en prendre acte et de réagir en conséquence.
Les pistes sont connues : efficacité énergétique des bâtiments, énergies renouvelables, mobilité durable, création de puits de carbone… Tout cela concourt à la réduction, l’évitement ou la compensation des émissions de dioxyde de carbone et équivalents – qui par ricochet freinent le réchauffement et atténuent ses conséquences.
Il n’en reste pas moins que des politiques publiques ambitieuses, des investissements massifs, une sensibilisation et une responsabilisation accrue de tous les acteurs économiques, ainsi qu’une collaboration efficace à l’échelle internationale, constituent autant de facteurs décisifs pour réussir la transition énergétique qui s’impose.
